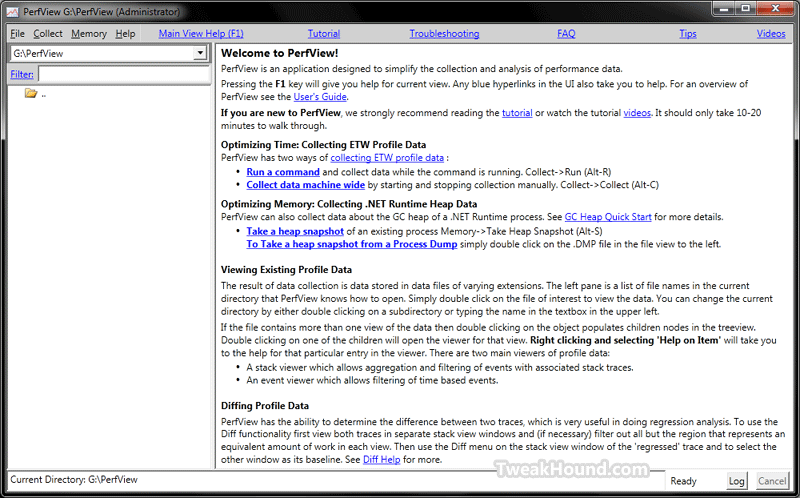
 Microsoft has released a new performance analysis called PerfView.
This one isn’t for the average user.
Download PerfView
More info: MSDN Blogs > Vance Morrison’s Weblog > Publication of the PerfView performance analysis tool!
PerfView is a tool for quickly and easily collecting and viewing both time and memory performance data. PerfView uses the Event Tracing for Windows (ETW) feature of the operating system which can collect information machine wide a variety of useful events as described in the advanced collection section. ETW is the same powerful technology the windows performance group uses almost exclusively to track and understand the performance of windows, and the basis for their Xperf tool. PerfView can be thought of a simplified and user friendly version of that tool.
Features include:
– Non-invasive collection – suitable for use in live, production environments
– Xcopy deployment – copy and run
– Memory
– Support for very large heaps (gigabytes)
– Snapshot diffing
– Dump files (.dmp)
– CPU Performance
– Support for managed, native, and mixed code
– Can read XPerf logs
– Profile diffingSupported Operating Systems: Windows 7, Windows Server 2008, Windows Server 2008 R2, Windows Vista
– Supports .NET Framework versions 2.0 and above

